

Music data company Luminate has published its annual ‘Year-End Music Report’, breaking out a wide range of stats and data to illuminate our understanding of modern music consumption.
By a wide margin, the “wow” stat from this year’s report is that India’s streaming market nearly doubled in 2023 - gaining nearly 464 billion new streams, to hit more than one trillion streams in total - 80% growth in a single year.
Apart from being a mind-bogglingly huge number, one trillion is, of course, a million million - or one followed by twelve zeroes: 1,000,000,000,000.
The USA, unsurprisingly, tops the chart of countries ranked by streaming volume, adding 184 billion new streams over 2022.
With almost 2.5 trillion streams between them, the USA and India massively outperform the other eight countries Luminate includes in its top ten list of countries by streaming volume - which are Mexico, Indonesia, Germany, Japan, UK, Canada and France.
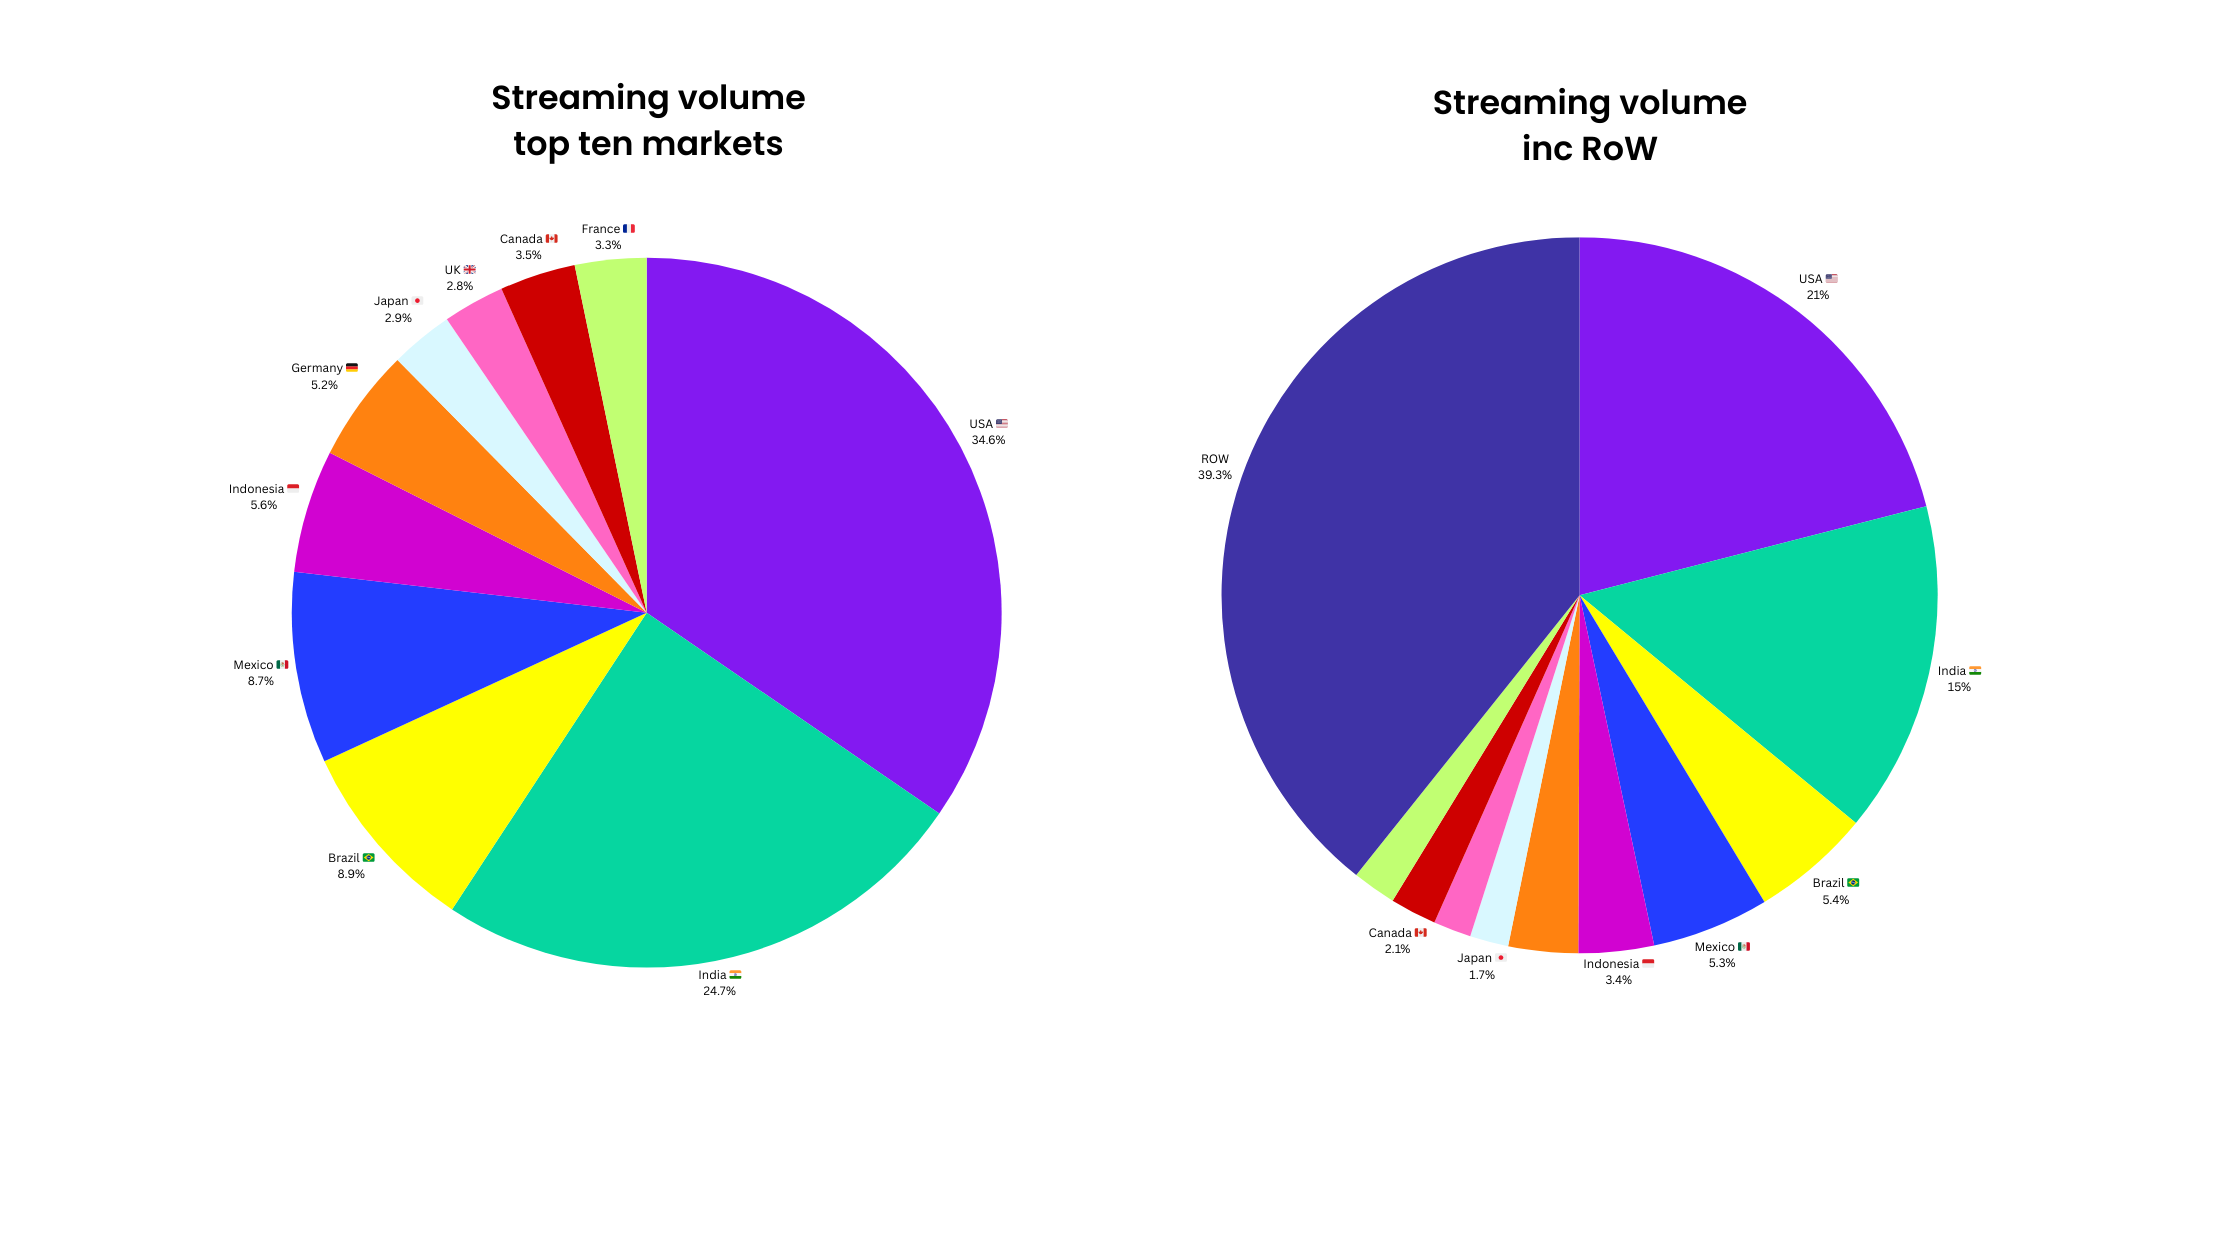
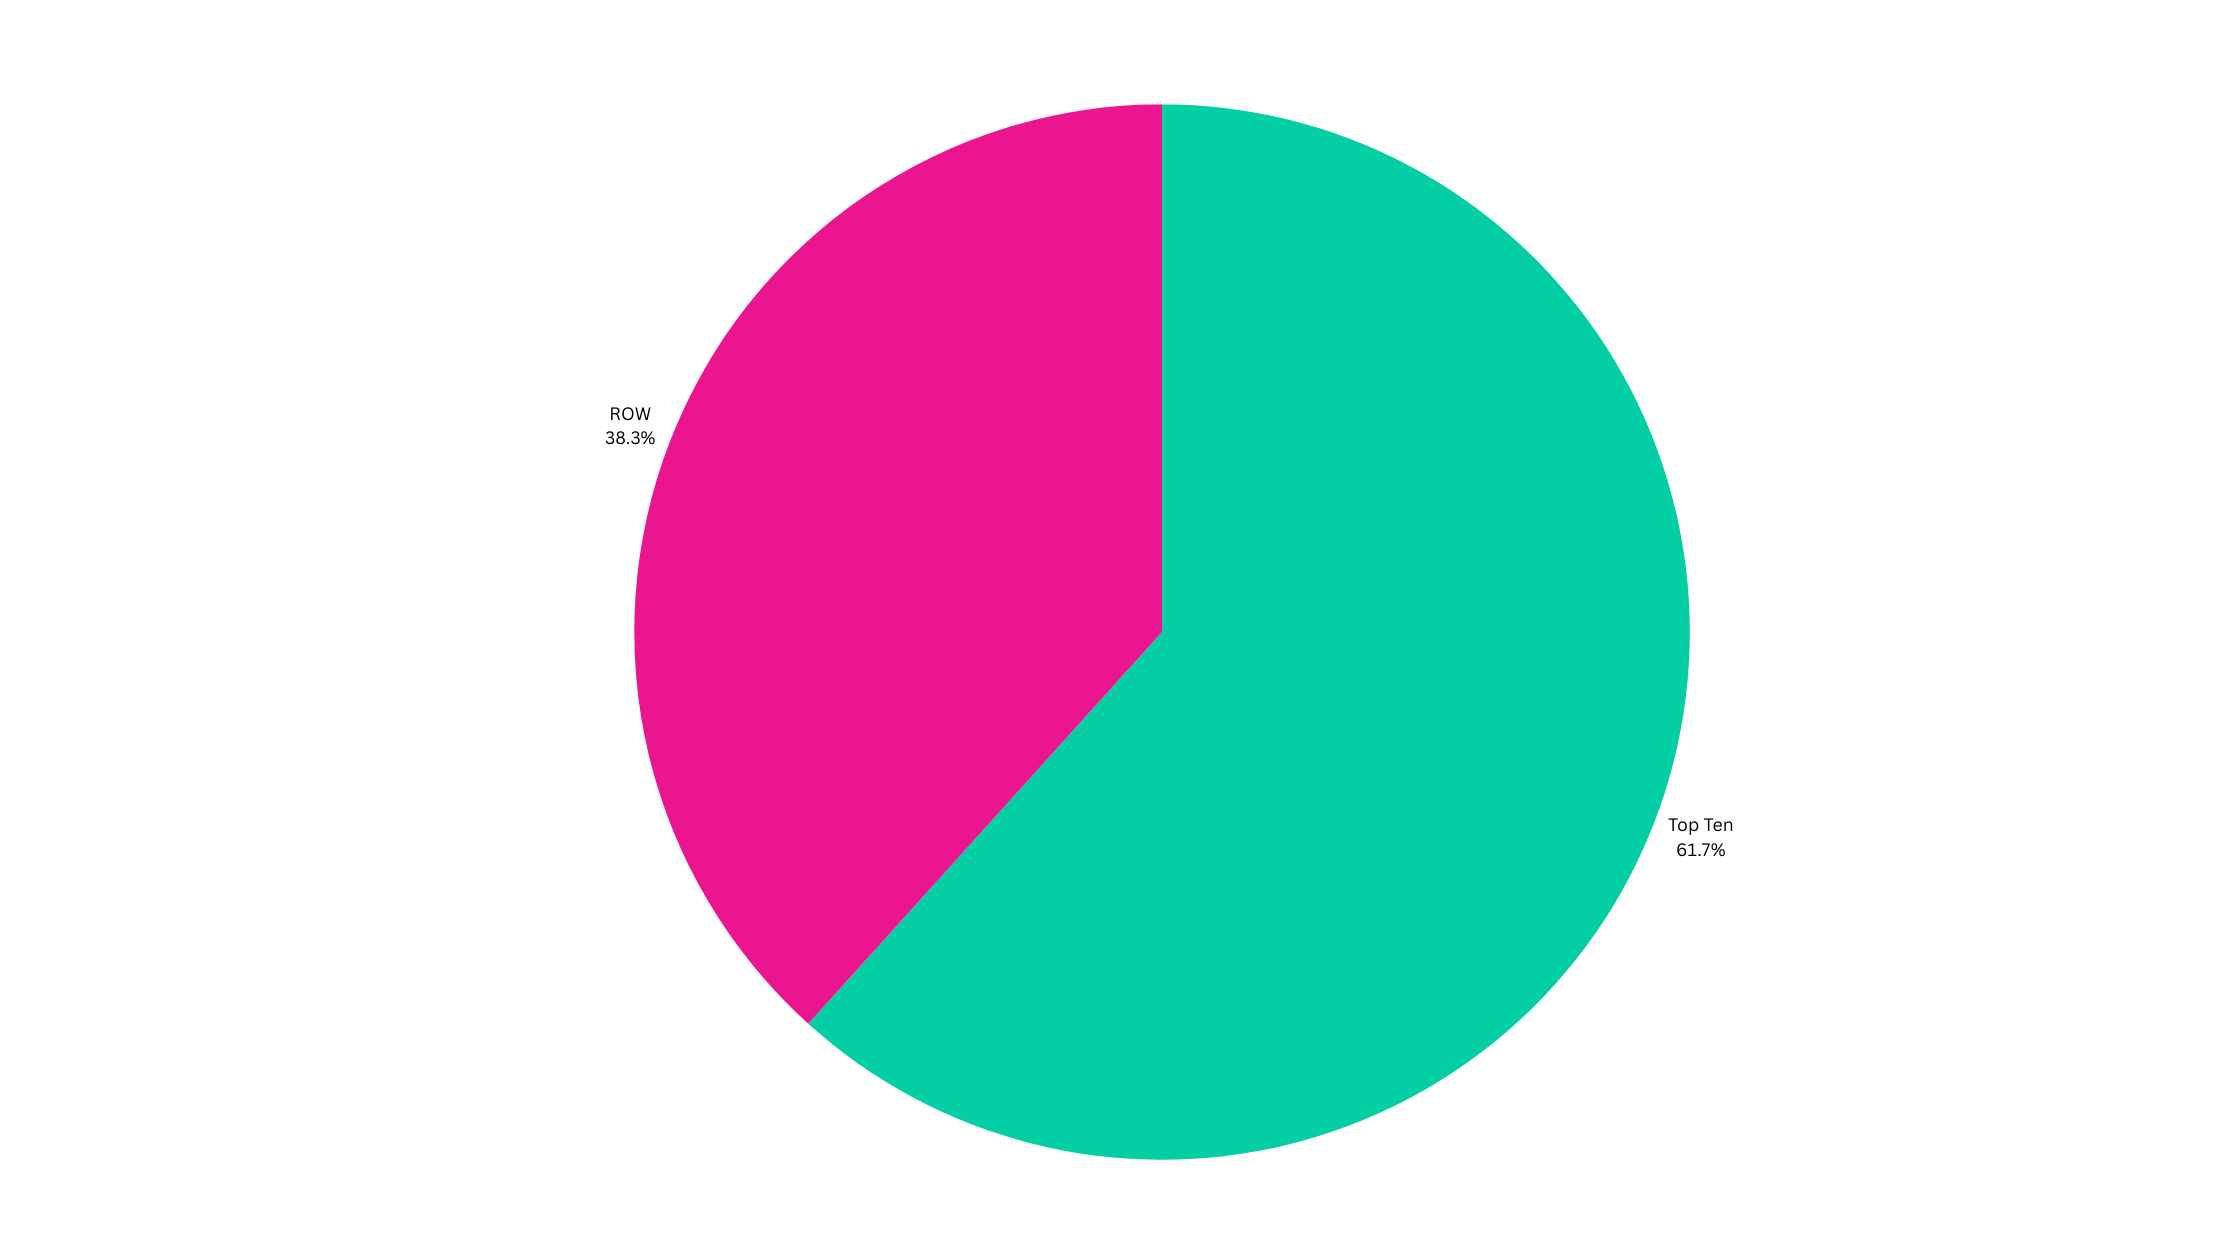
Those countries - combined - represent “just” 1.889 trillion streams between them, meaning streams across those top ten markets gross to 4.38 trillion streams. This means the rest of the world saw 2.72 trillion streams, for Luminate's 2023 total of 7.1 trillion global streams.
The numbers relating to streaming volumes presented by Luminate relate to all streams - premium and ad-supported, on both audio-only and audio-video platforms. So, for example, these numbers include data from YouTube and Meta, as well as services like Spotify and Apple Music.
That said, Luminate does provide a global comparison for audio streams vs audio + video streams. At a global level there were 7.1 trillion audio + video streams, of which 4.1 trillion were audio. While the ratio of AV streams to audio streams will vary from country to country - and in some cases significantly - this provides a useful ‘rule of thumb’ metric to apply to other data in the report: as a rough estimation we can say that around 57.7% of total streams are audio streams.
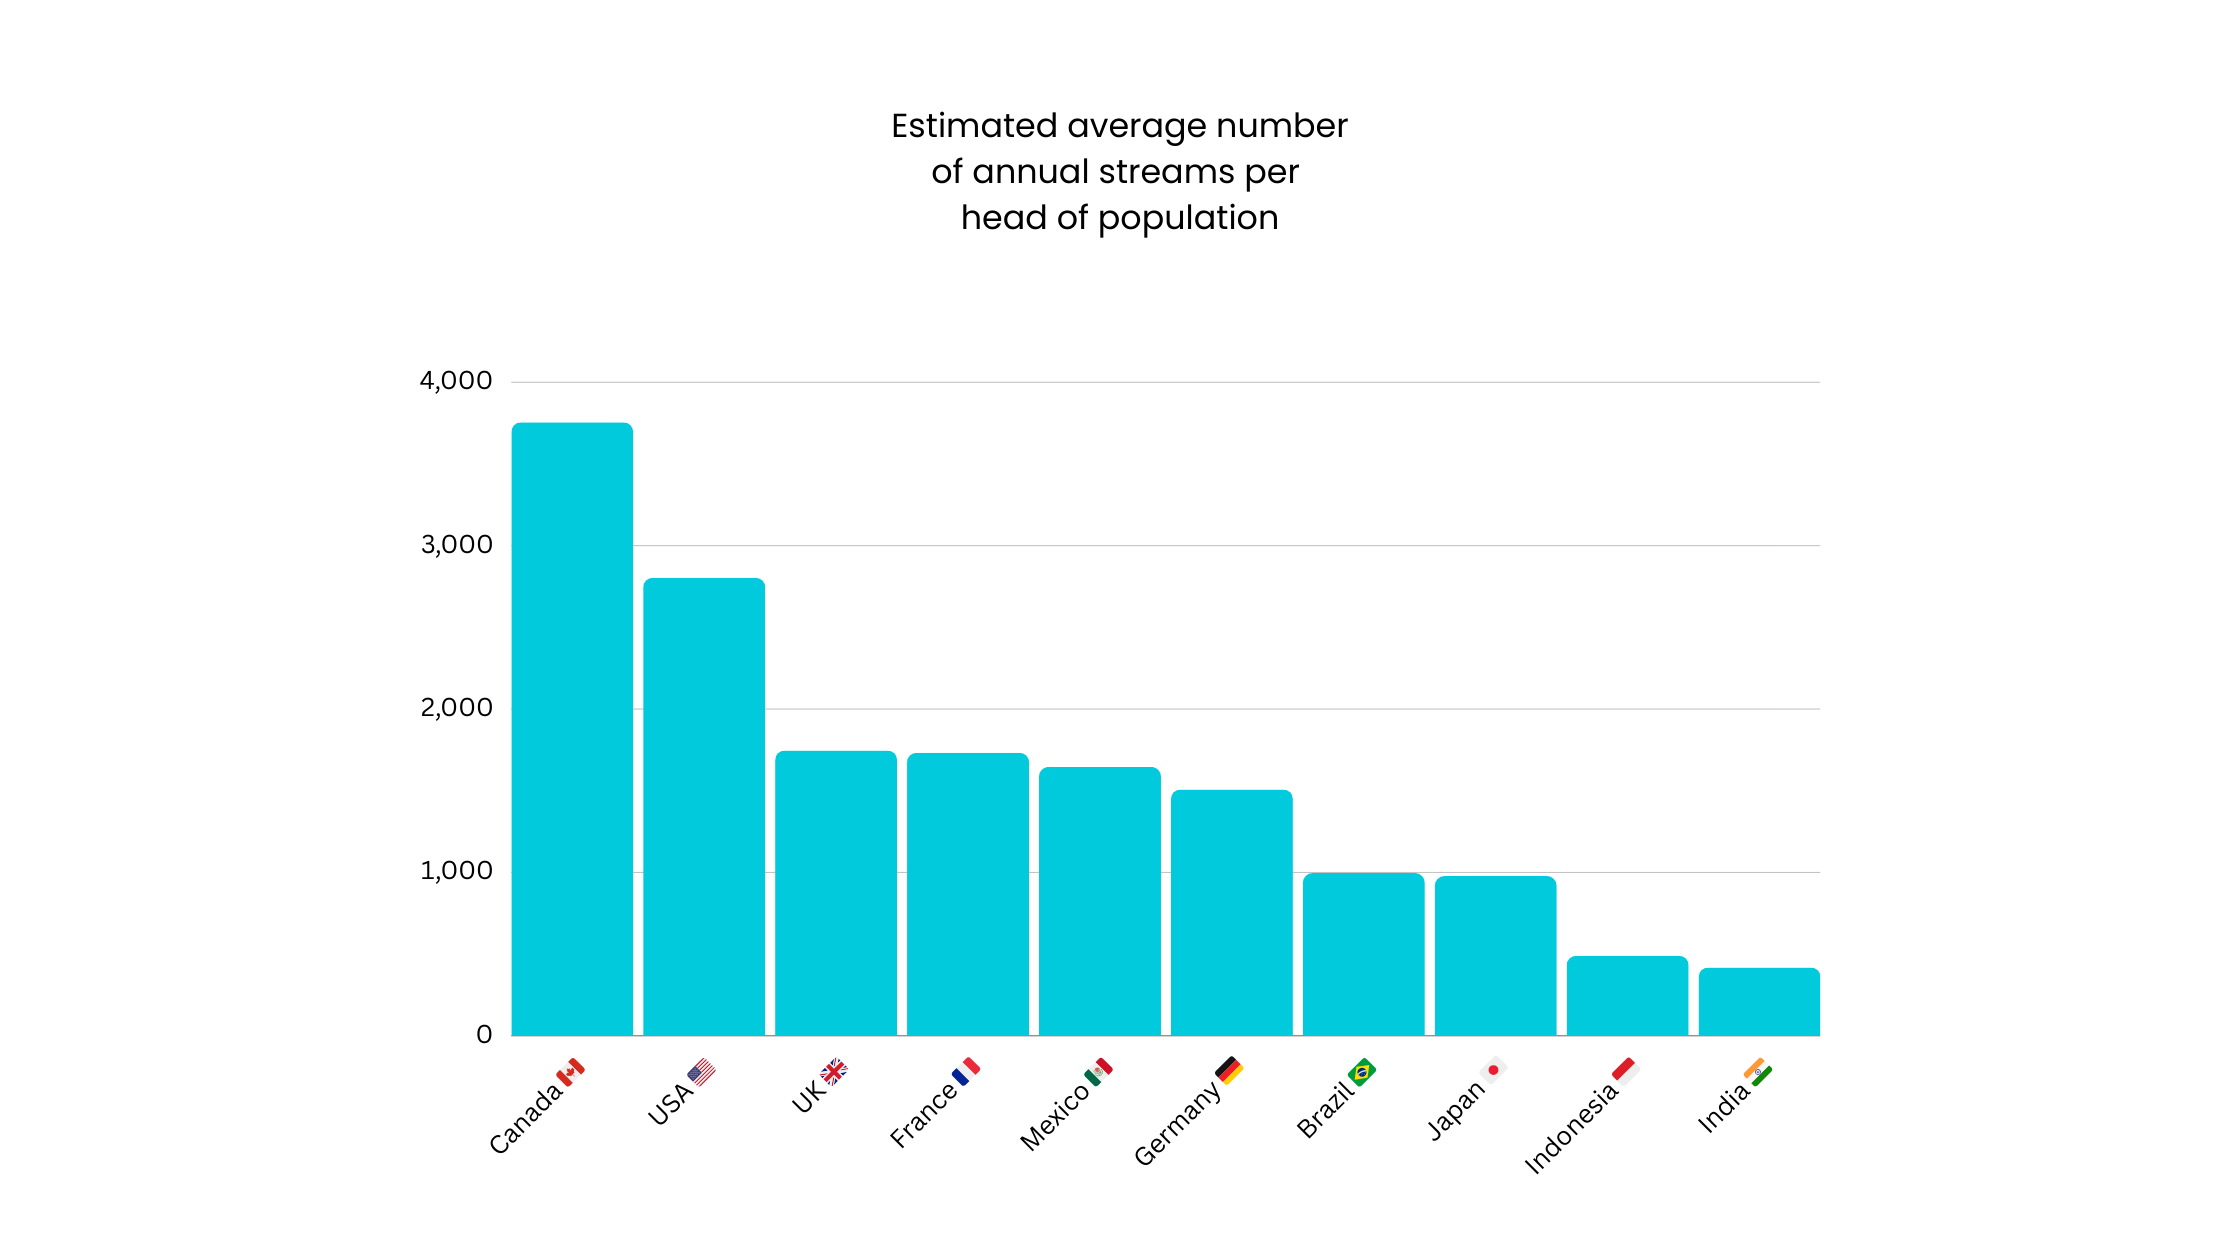
CMU has performed additional analysis on these numbers, breaking out the total number of streams in each country by the average number of streams per head of population.
For the USA - with 1.454 trillion streams and an estimated population of around 334.2 million people - this means average number of streams per head of population was 4350. Put another way, every single person in the USA would need to stream around twelve songs every single day to hit 1.454 trillion streams.
| Country | Total (billion) | Audio (billion) | Population (million) | TS p/h | AS p/h | AS p/d |
|---|---|---|---|---|---|---|
| USA | 1454 | 838.9 | 334.2 | 4350 | 2804 | 7.7 |
| India | 1037 | 598.3 | 1430 | 725 | 418 | 1.2 |
| Brazil | 373.5 | 215.5 | 216.4 | 1726 | 996 | 2.7 |
| Mexico | 366.5 | 211.5 | 128.5 | 2852 | 1646 | 4.5 |
| Indonesia | 235.5 | 135.9 | 277.5 | 848 | 490 | 1.3 |
| Germany | 217.6 | 125.6 | 83.3 | 2612 | 1508 | 4.1 |
| Japan | 120.6 | 120.6 | 123.3 | 1695 | 978 | 2.7 |
| UK | 118.1 | 118.1 | 67.6 | 3028 | 1747 | 4.8 |
| Canada | 145.3 | 83.8 | 38.7 | 3755 | 2165 | 5.9 |
| France | 136.9 | 79 | 68 | 2013 | 1733 | 4.7 |
Note:
TS p/h = Averaged total streams per head of population
AS p/h = Averaged audio streams per head of population
AS p/d = Averaged total audio streams per head of population per day
Ranked by consumption per head, that chart looks quite different:
| Country | Total streams per head |
|---|---|
| USA | 2804 |
| Canada | 2165 |
| UK | 1747 |
| France | 1733 |
| Mexico | 1646 |
| Germany | 1508 |
| Brazil | 996 |
| Japan | 978 |
| Indonesia | 490 |
| India | 418 |
These numbers are interesting for two reasons.
Streaming benchmarks
First of all, it gives a very approximate benchmark for what streaming performance may look like in each country. It’s important to caution that there are a lot of blunt assumptions here: we are taking aggregated numbers, applying a global multiplier to approximate audio streams vs audio + video streams, and then factoring that against rough population estimates.
But - with that very strong caution in mind - you could say that the “average” number of streams per head of population in the UK is somewhere around 1800 streams a year, giving a performance benchmark for consumption of an artist or label’s music. If you’re driving 180 streams per UK listener, for example, then that would represent a significant share of the population average.
For example, from BPI data recently published we know that the UK saw 179.6 billion audio streams in 2023 - so the ratio here is 87.7% - or, in other words, the 179.6 billion audio streams detailed by BPI represented 87.7% of the total audio streams detailed by Luminate. This is not unexpected though - the UK is a very well developed streaming market so it would not be a surprise if a higher number of people are consuming audio streams via streaming platforms, rather than listening to music via - for example - YouTube videos.
Potential for streaming growth in developing markets
The second reason these numbers are interesting is that broken out like this the numbers show the potential growth still to be achieved by streaming. If India can continue to deliver mid double digit percentage growth against stream volumes year on year for the next five years to average 30% growth YOY over that period, it’s easy to see how that single market could be hitting 4 trillion streams or more a year by 2030.
That growth - 30% each year - would see it level up to 2691 streams per head of population, for a total of 3.8 trillion streams. Ambitious, perhaps, but not impossible if you look at Mexico. Even if India levelled off at Brazil’s 1726 streams per head, this would still bring nearly 2.5 trillion streams - and, of course, the revenue those streams would generate for rightsholders.
Luminate also highlights two key African countries - Nigeria and Kenya, claiming 98% and 99% “overall streaming penetration among all music listeners” respectively. With 226.2 million people in Nigeria, and 55.1 million in Kenya, the countries provide significant potential.
IFPI’s recent ‘Engaging With Music’ report gave a little more detail on Nigeria, Indonesia and India.
As a global average people spend 20.7 hours listening to music each month - of which 32%, or 397 minutes (6 hours 37 minutes) is spent consuming music via audio streaming. At a global level, 29% of people said that they consumed music using unlicensed or illegal methods.
In Nigeria, the average listening is 31.1 hours a month, with Indonesia and India reporting 28.3 hours and 24.4 hours respectively - but all three countries have huge levels of unlicensed consumption, with three quarters of Indian and Nigerian music consumers using pirate services, and two thirds of those in Indonesia. If we apply the 32% metric to these numbers, that means streaming could be as much as 597 minutes consumption in Nigeria, 543 minutes in India, and 468 minutes in Indonesia - all well over the global average.
The reason this is important is that on this basis these countries all over index for both music consumption generally and unlicensed consumption, indicating possible potential for licensed streaming’s share of consumption to grow. This presents a strong signal that - with the right offer - consumers in these countries may be receptive to shift their consumption to licensed streaming services. Quite how that shift will be effected is yet to be fully determined - but the potential rewards for rightsholders are significant.
However, one note of caution here is that streaming volume does not necessarily translate directly to streaming revenue. As we’ve seen across developing markets, subscription streaming services often have to incentivise consumers with discounts, bundles and other promotions to drive adoption and capture market share, which can mean the route to significant revenue can be long and complex. And, as we’ve seen from Spotify’s quarterly numbers, the costs of breaking into new markets can be high.
Challenges for streaming services in developed markets
However, alongside the opportunities presented by these high-potential developing markets, these stats also show the challenges streaming services have when it comes to further developing well established markets. One sobering fact reported by Luminate is that US monthly streaming spend by Gen Z dropped 11% in 2023.
Admittedly growth for Millennials, Gen X and Boomers continued in 2023, but if a key demographic is dropping off or plateauing what does it mean for major market growth? Can the US break 5000 streams per head of population? And how do you grow advanced markets like the UK, Germany, Japan and France - all wealthy, technologically advanced countries that have traditionally been valuable music markets - to the level of streaming activity seen in the USA and Canada?
Once again, the same word of caution applies here: simply increasing streaming volumes does not necessarily mean increased revenue for either streaming services or rightsholders, and it’s likely that the incremental growth for streaming volumes in developed markets is more likely to come from existing users or plan dilution - single premium users switching to a family plan, for example.
However, growing streaming in developed markets is expensive and delivers only incremental returns. Without doubt - and as seen by the raft of deals the major music companies have done in India over the past couple of years - investment is going to shift to markets where growth is cheap and current performance is far below established markets.
Whether that’s streaming platforms investing in subscriber growth initiatives, or rightsholders like labels and publishers investing to grow market share, the next five years in music are going to be defined by what happens in India and other high-potential markets.
Growth of non-English language content
Unsurprisingly, as India sees exponential growth in streaming, Hindi language tracks are increasing in popularity as well. In 2021, English language tracks represented 67% of the top 10,000 global tracks, a number which has dropped by over 12% to just 54.9% in 2023, while Hindi tracks have more than doubled their share rising from 3.8% in 2021 to 7.8% today.
Focusing in on specific genres - Afrobeats, country, dance/electronic, US hip hop/R&B, K-pop and Latin - Luminate highlighted markets that offer particularly strong performance for those genres beyond their home markets. For example, Afrobeats tracks - outside the Middle East and Africa - perform particularly well in Luxembourg, Netherlands, France, United Kingdom and Portugal, while dance/EDM - outside the US - shows strong performance in Vietnam, Slovakia, Croatia, Malaysia and Hungary.
Catalogue consumption
Catalogue consumption continues to drive significant numbers of streams, with just 48.3% of top 500,000 tracks in the US released in the past five years. To be more explicit, this means that the majority of the top 500,000 tracks in the US were released before 2018.
Monetisation threshold
Meanwhile, Luminate says that it tracked 184 million total audio ISRCs in 2023, with an average of 103,500 new ISRCs delivered to digital service providers each day - and 96.1% of those came from non-major distributed content providers. While one of the music industry’s favourite lazy stat is “there’s just so much music, a billion tracks are uploaded to streaming platforms every minute”, it’s important to remember that one ISRC does not necessarily equal one track; what appears to be a single track on the consumer facing side of the music business can have multiple ISRCs associated with it on the back end.
Notwithstanding, of those 184 million ISRCs, 45.6 million - nearly 25% - received no streams at all, while 152.2 million (or 106.6 million, excluding ISRCs that received no streams at all) were streamed 1000 times or less - potentially placing nearly 83% of the total streaming catalogue underneath the new ‘artist-centric’ monetisation threshold championed by Spotify, Universal and Warner, meaning under that model they would likely receive no money at all for their music.
In fact, just 436,000 ISRCs - or one out of every 422 - managed to hit more than one million streams last year - a tiny 0.2% of the total catalogue.
